A Deeper Look at Latency

Human behavior is finely tuned for immediate visual feedback from the world around us.
Latency in our vision can make even simple everyday tasks difficult. In this video, even though people are seeing their surroundings at a continuous 60 frames per second, the latency in their view completely debilitates them.
Once other humans are involved in an interaction with latency, the problems are amplified. Here's a humorous example that shows how a feedback cycle can break down with latency.
Network Latency
Since the advent of networked multiplayer games, the processing power of gaming devices and throughput of the networks have increased by orders of magnitude. Yet the problems of latency persist in action multiplayer games.
Compared to landlines, both cellular and WiFi network connections, show far more latency problems in these games. Action game play is very sensitive to the larger magnitude and the variable nature of wireless latency. Precise timing is required for natural interaction of players in these games.
Understanding Mobile Latency
First, we will examine the magnitude and nature of latency in wireless network connections.
Ookla SpeedTest: Picking the Best of Ten Samples
Have you ever wondered why many latency measurements quoted in reviews of service providers seem optimistic?
Ookla SpeedTest is perhaps the most widely used (5 million tests per day) testing tool for Download / Upload Speeds (kbps) and “Ping” latency (msecs). A closer look at the test flow, which is publicly shared by Ookla on the company web site, reveals that latency reported by the tool is the smallest of 10 consecutive tests, waiting 50 msec between the tests. It is also not an ICMP echo response test but an HTTP response test to the server.
Servers may give lower priority to ICMP echo requests over HTTP requests for security and performance reasons; so it is easier to justify the latter. However, taking the smallest of 10 consecutive response times creates a significant bias. Put differently, nine out ten responses actually took longer than the reported time.
So, how much is the bias? We ran a little simulation. We assumed that the response times were exponentially distributed with a mean value of 100 ms. Over a sample of 1 million runs of ten tests each, the average of the best of ten is 10 ms. In other words, it is optimistic by 10x.
In Octave:
octave:1> a=rande(10,1000000)*.1;# 10 x 1,000,000 matrix of random exponentials (mean .1)
octave:2> mean(a(:)) # sample mean check
ans = 0.10002
octave:3> mean(min(a)) # mean of 1,000,000 column-wise minima (ten samples in a row)
ans = 0.010008
Average versus the 95th Percentile
In a given distribution of network latency, the worst offenders (tails) have disproportionately larger effect. For example, you may design and test your game for the 95th percentile latency. If so, what is the relation between the mean value and the 95th percentile in an exponential distribution?
Answer: approximately 3x the mean value.
octave:1> -log(1 – 0.95)
ans = 2.9957
When two random variables with the same exponential distribution are added, the resulting sum is a convolution of two identical exponential distributions. The sum has its 95th percentile value at approximately 4.78x the mean value of the exponential distribution.
Understanding Variable Nature of Mobile Latency
Traffic Bursts and Storms
So far we have looked at a stationary exponential distribution. However, traffic storms on carrier / enterprise networks and on the public Internet can create highly episodic problems.
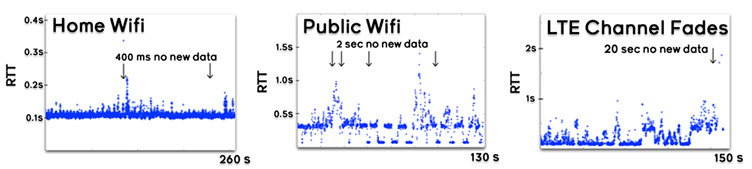
Channel Fading
Radio channels, both cellular and WiFi, are subject to fading arising from the physical nature of the channel.
Fading causes network latency and channel capacity to vary widely over time. LTE networks in metro areas often go seconds without new data.
Latency in Multiplayer Sync Action Games
Player to Player System RTT versus Network RTT
So how does all this latency affect game play? Hold on a second— the latency doesn’t only come from the network. We must realize that there is not only network latency, but also the time it takes for the signal to be received, processed, and rendered on the other player’s screen. Full one-way latency includes the time from one player’s input, to when the corresponding action is displayed on the other player’s screen—round trip includes the reverse direction.
Real Time for Games, What it is and Why it Matters
Rendering at full 60 frames per second (16.6 msec) is considered real time in graphics and game physics communities, even though the processing of player’s inputs may not propagate to the displayed image for seven frames (117 msecs). In other words, large latency is not even considered in evaluating real-time computing performance.
Contrast that to real time computing performance in control of a physical system like an automobile, aircraft or a robot. Embedded systems, software and hardware, are designed to meet deadlines of the natural physical world, i.e. true real-time. A digital control system loop is typically designed to run at a fixed sample rate, say 100 samples per second. The computations are performed within a fraction of that sample time and the actual sampling of the inputs from the controlled physical object and actuations are performed precisely at the deadlines with variation of no more than a few percent of the sample time.
Multiplayer action games are sensitive to insertion of latency in the loop similar to real-time control systems because human players are in intense purposeful action-reaction cycles with each other. Human-machine interactions in remote manipulation of robots and VR head motion tracking are other examples of high sensitivity to latency in the loop.
Not All Latencies are Equal
Actual latency in the player-to-player loop varies as the wireless network inserts variable latency and channel drops. Contiguous data over multiple frames often bunch up in the wireless channel and then gets forwarded to the other device all at once. This kind of time-correlated latency is harder to deal with than independently distributed random exponential latency.
Testing Effect of Latency in MultiPlayer Games
We tested how both console and mobile games performed with network latency. We used dummynet to insert network latency between game devices on a local network. After some experience in testing, we decided to test with controlled conditions to ensure that we can compare game play outcomes over several minutes of game plays with the same players. For each test, we inserted a fixed symmetric synthetic latency on a local area network using dummynet. In case of iPads, an equivalent iOS network Link Conditioner was used. We varied the fixed synthetic latency over the tests to find out when game play began to show consistent, repeatable problems. In all cases, we ensured that there was no other significant traffic on the network. We also verified game packet path and the network latency with other tools.
Check out our testing videos here.